Basic JMeter Framework Example
Below is a basic workflow for executing a JMeter test which is available
on GitHub. You can paste this directly into the YAML of an existing or new test, just make
sure to update the name and namespace for your environment if needed.
- The
spec.contentproperty defines the location of the GitHub project - the
spec.stepsproperty defines a single step that runs the test and uploads the created reports.
Basic JMeter Workflow
apiVersion: testworkflows.testkube.io/v1
kind: TestWorkflow
metadata:
  name: jmeter-sample
  namespace: testkube
  labels:
    docs: example
spec:
  content:
    git:
      uri: https://github.com/kubeshop/testkube
      revision: main
      paths:
      - test/jmeter/jmeter-executor-smoke.jmx
  container:
    workingDir: /data/repo/test/jmeter
  steps:
  - name: Run tests
    shell: mkdir -p /data/artifacts && jmeter -n -t jmeter-executor-smoke.jmx -j /data/artifacts/jmeter.log -o /data/artifacts/report -l /data/artifacts/jtl-report.jtl -e
    container:
      image: alpine/jmeter:5.6
    artifacts:
      paths:
      - '/data/artifacts/**/*'
The workflow runs JMeter with -e -o /data/artifacts/report, which generates the JMeter dashboard report. The
dashboard includes report/statistics.json; when that file is uploaded as an artifact, Testkube can detect it as
a jmeter.statistics report and ingest its aggregated values as Performance Metrics.
After execution, you can see the output from the test executions under the executions panel tabs:
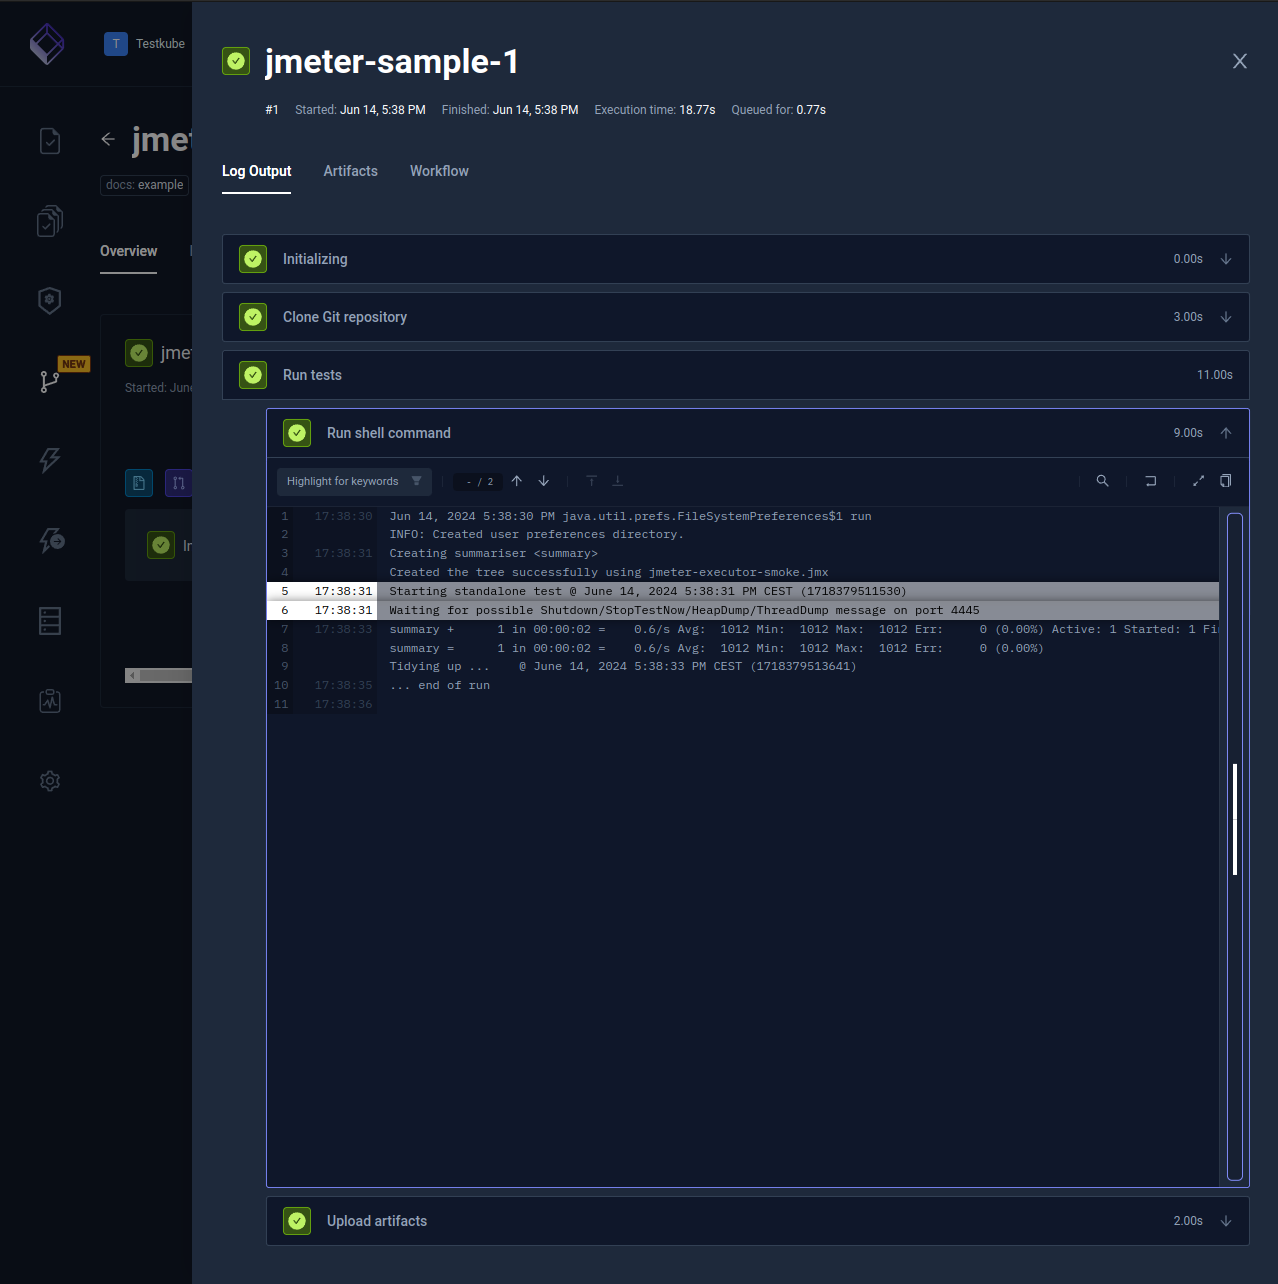
- Log Output
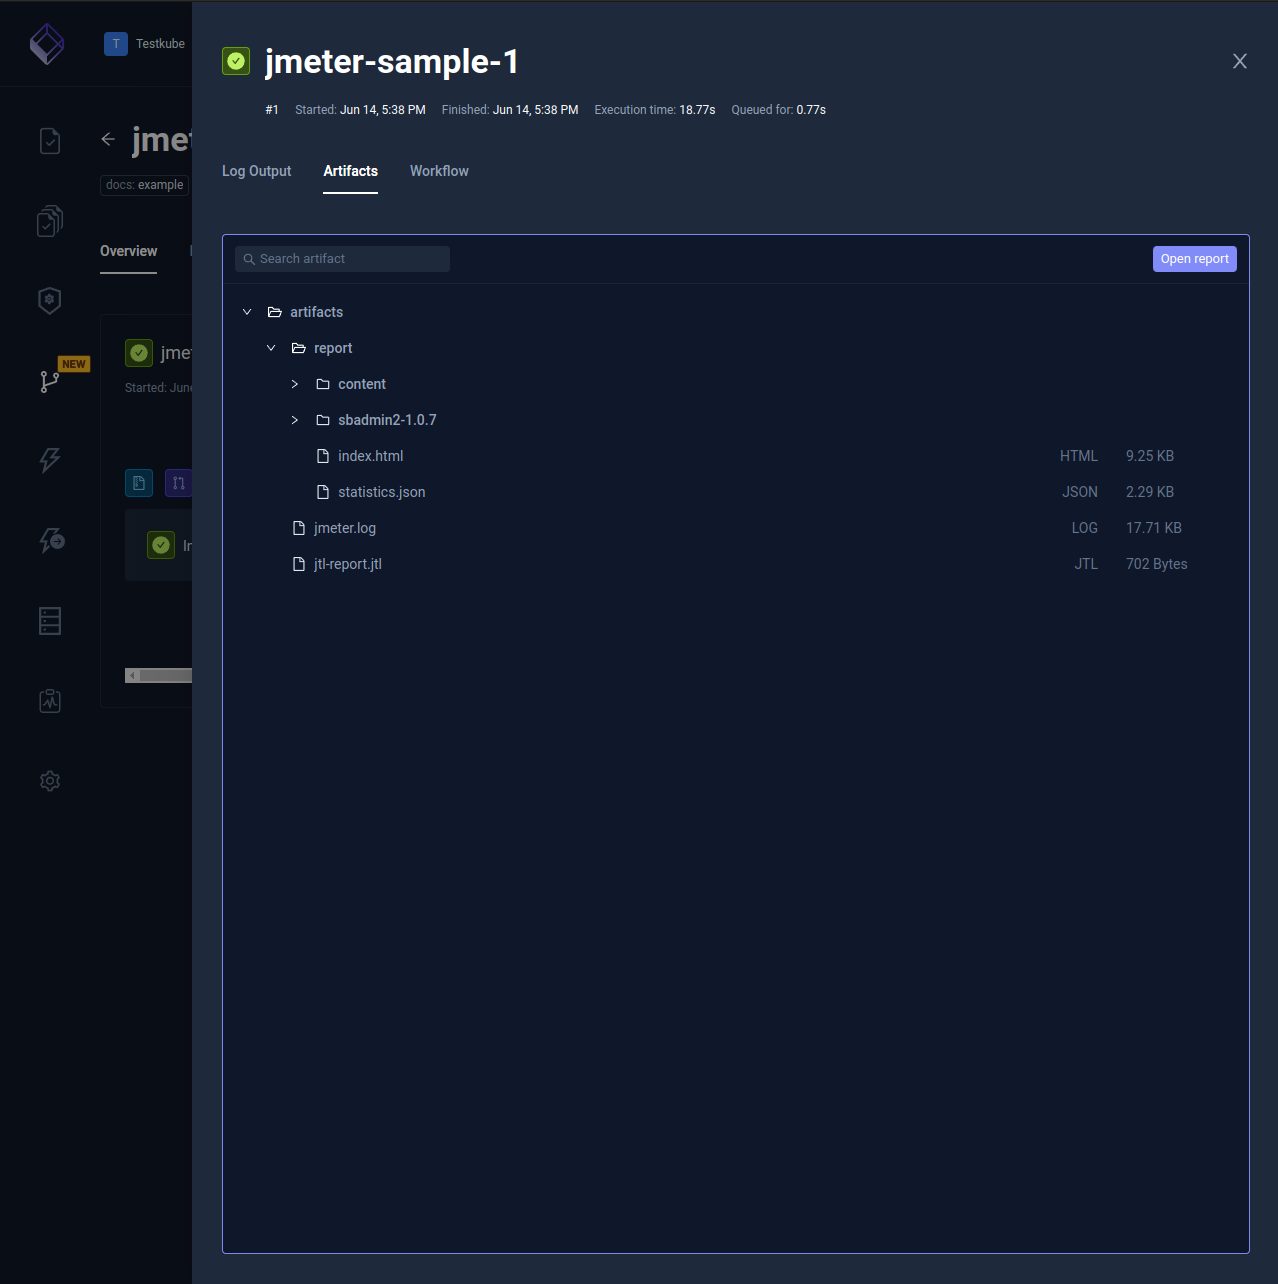
- Artifacts
The log output from the JMeter execution:
The uploaded report is available in the Artifacts tab: