JUnit Processing and Visualization
Testkube provides comprehensive support for processing and visualizing JUnit XML reports generated during Test Workflows.
This page explains how Testkube handles these reports and presents the information to users.
JUnit Report Extraction
Testkube automatically scans all artifacts for .xml files that are valid JUnit XML reports.
It then parses their contents to make them available for various reporting and visualization features. Read more.
Artifact Collection
To ensure that your JUnit reports are processed, you need to collect them as artifacts.
For detailed information on artifact collection in Test Workflows, please refer to our Test Workflows Artifacts page.
Visualization Features
Testkube provides multiple ways to visualize and interact with the processed JUnit reports:
1. Execution Overview Tab
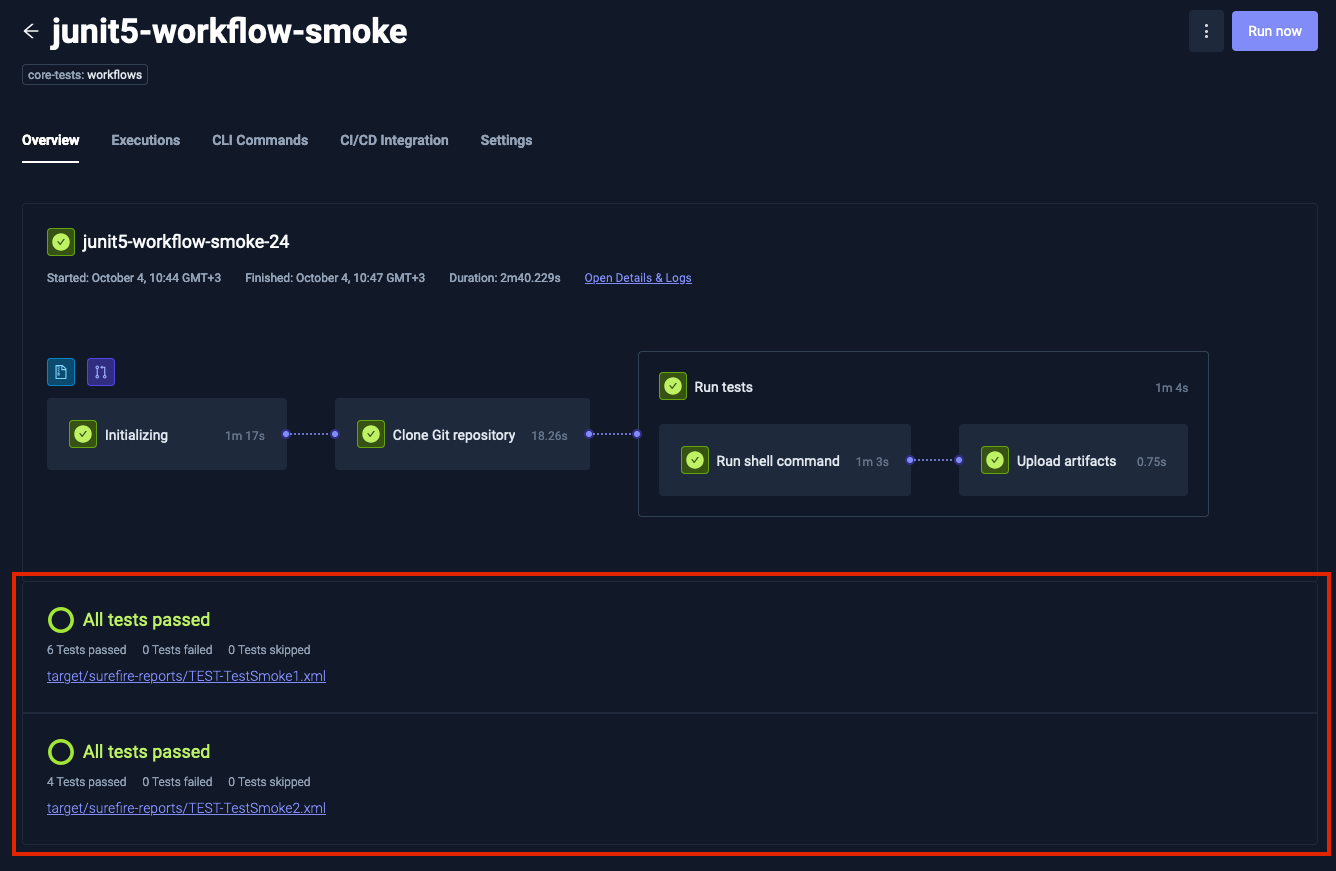
On the Overview tab of an Execution page, you'll find a new section dedicated to JUnit reports. This section is located below the execution flowchart and provides:
- A summary of all processed JUnit reports
- The overall status of the tests
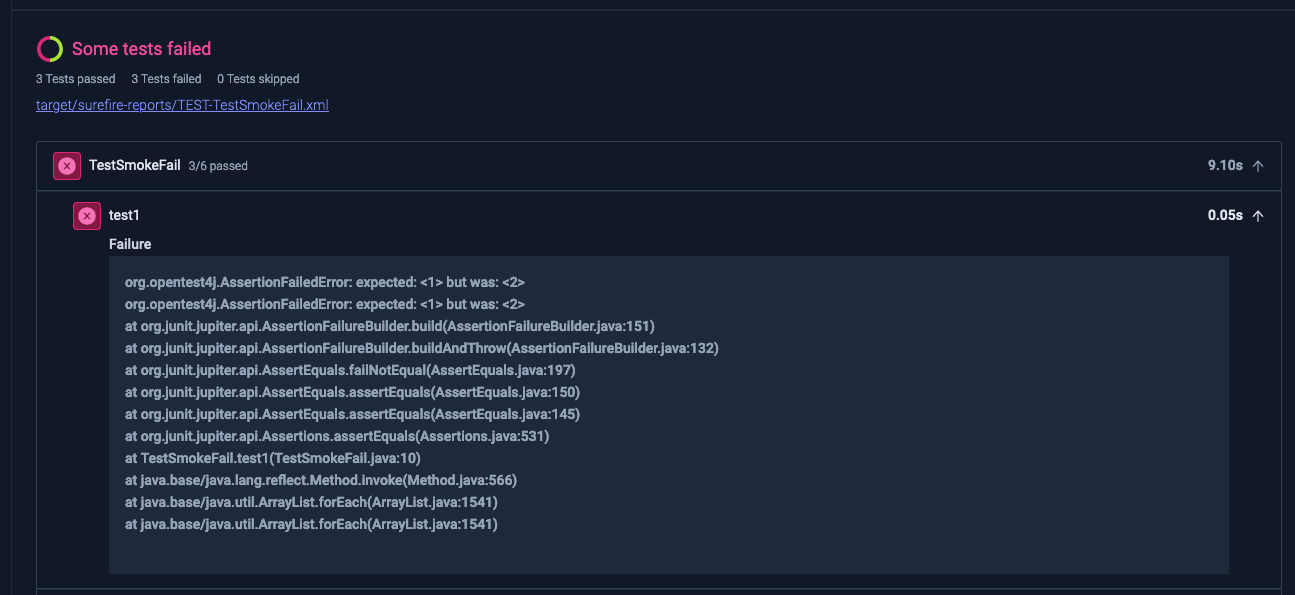
- Immediate visibility of any errors and their associated logs
This at-a-glance view allows for quick assessment of test results and easy identification of any issues that require attention.
2. Reports Tab
For a more detailed examination of your JUnit reports, navigate to the Reports tab of the execution. Here, you'll find:
- A comprehensive view of all processed reports
- A search bar for filtering test suites and test cases
- Options to filter results by "passed", "skipped or "failed" status
- Inlining of artifacts related to passed or failed excecutions
This detailed view allows for in-depth analysis of test results and easy navigation through large sets of test data.
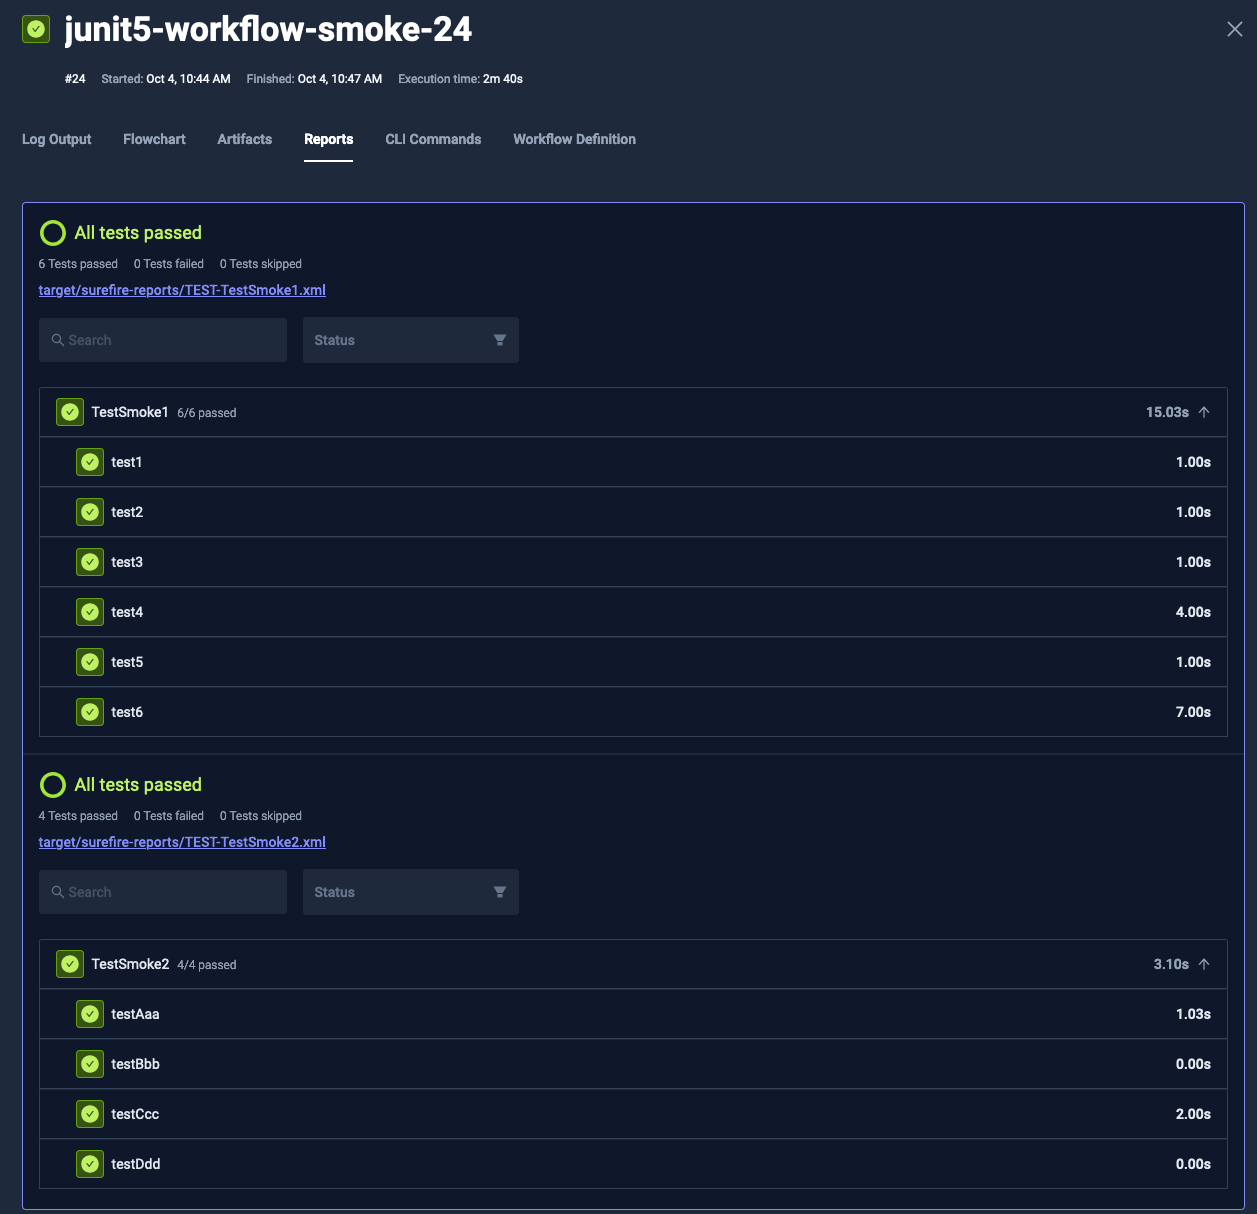
Example with filtering options:
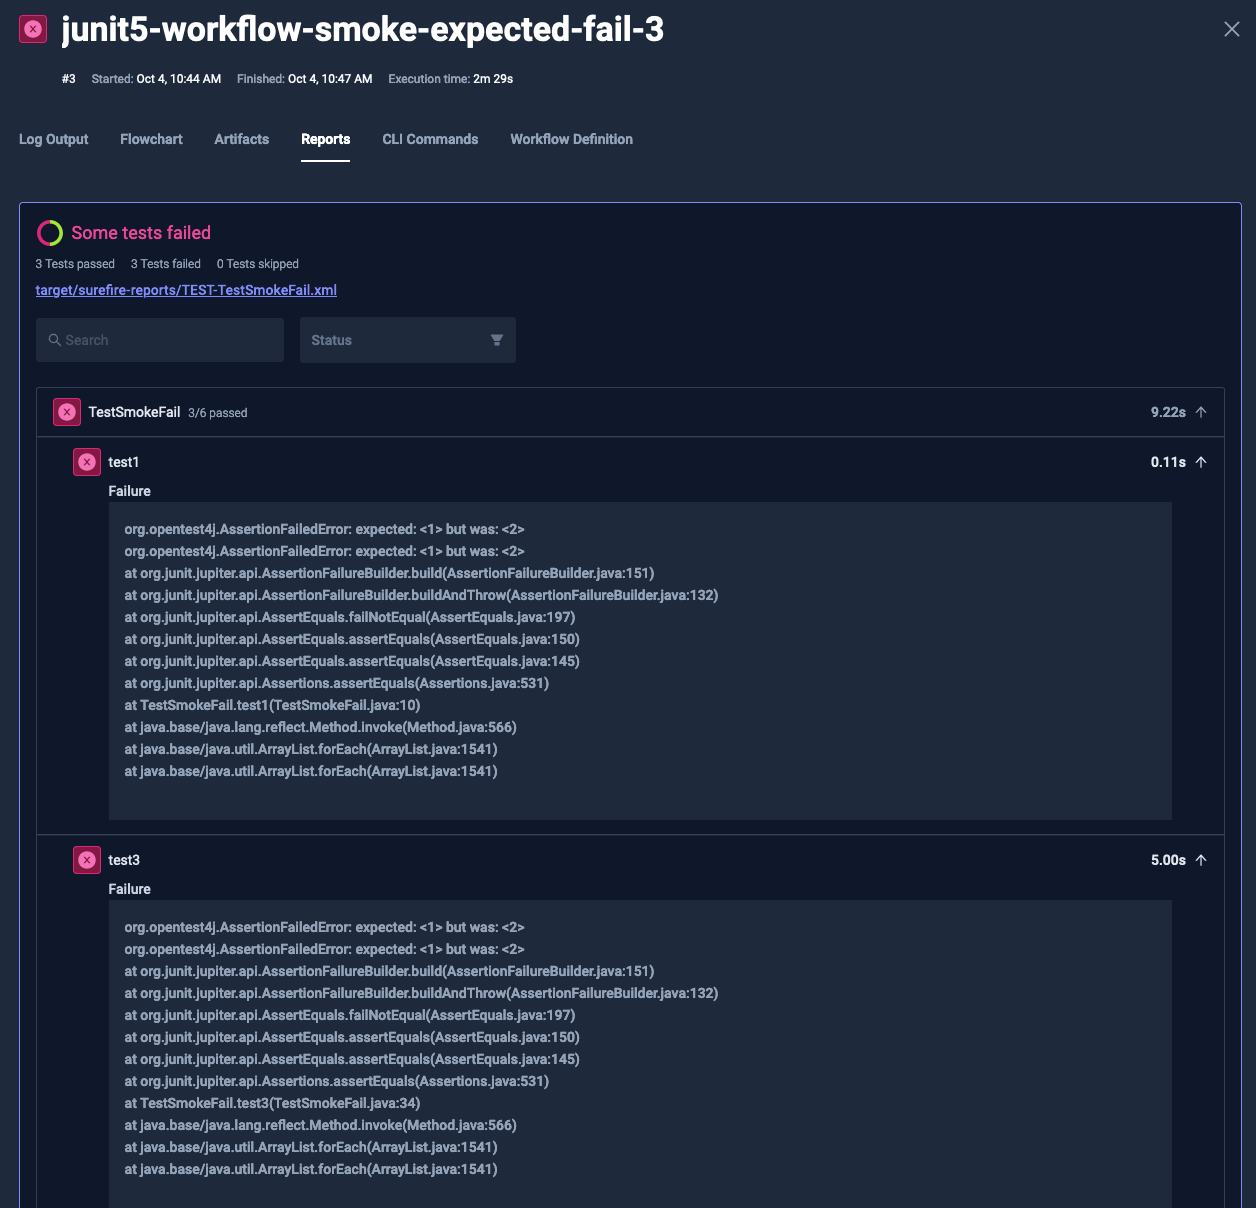
Example with inlined attachments - images will be shown in a small hover-popup:
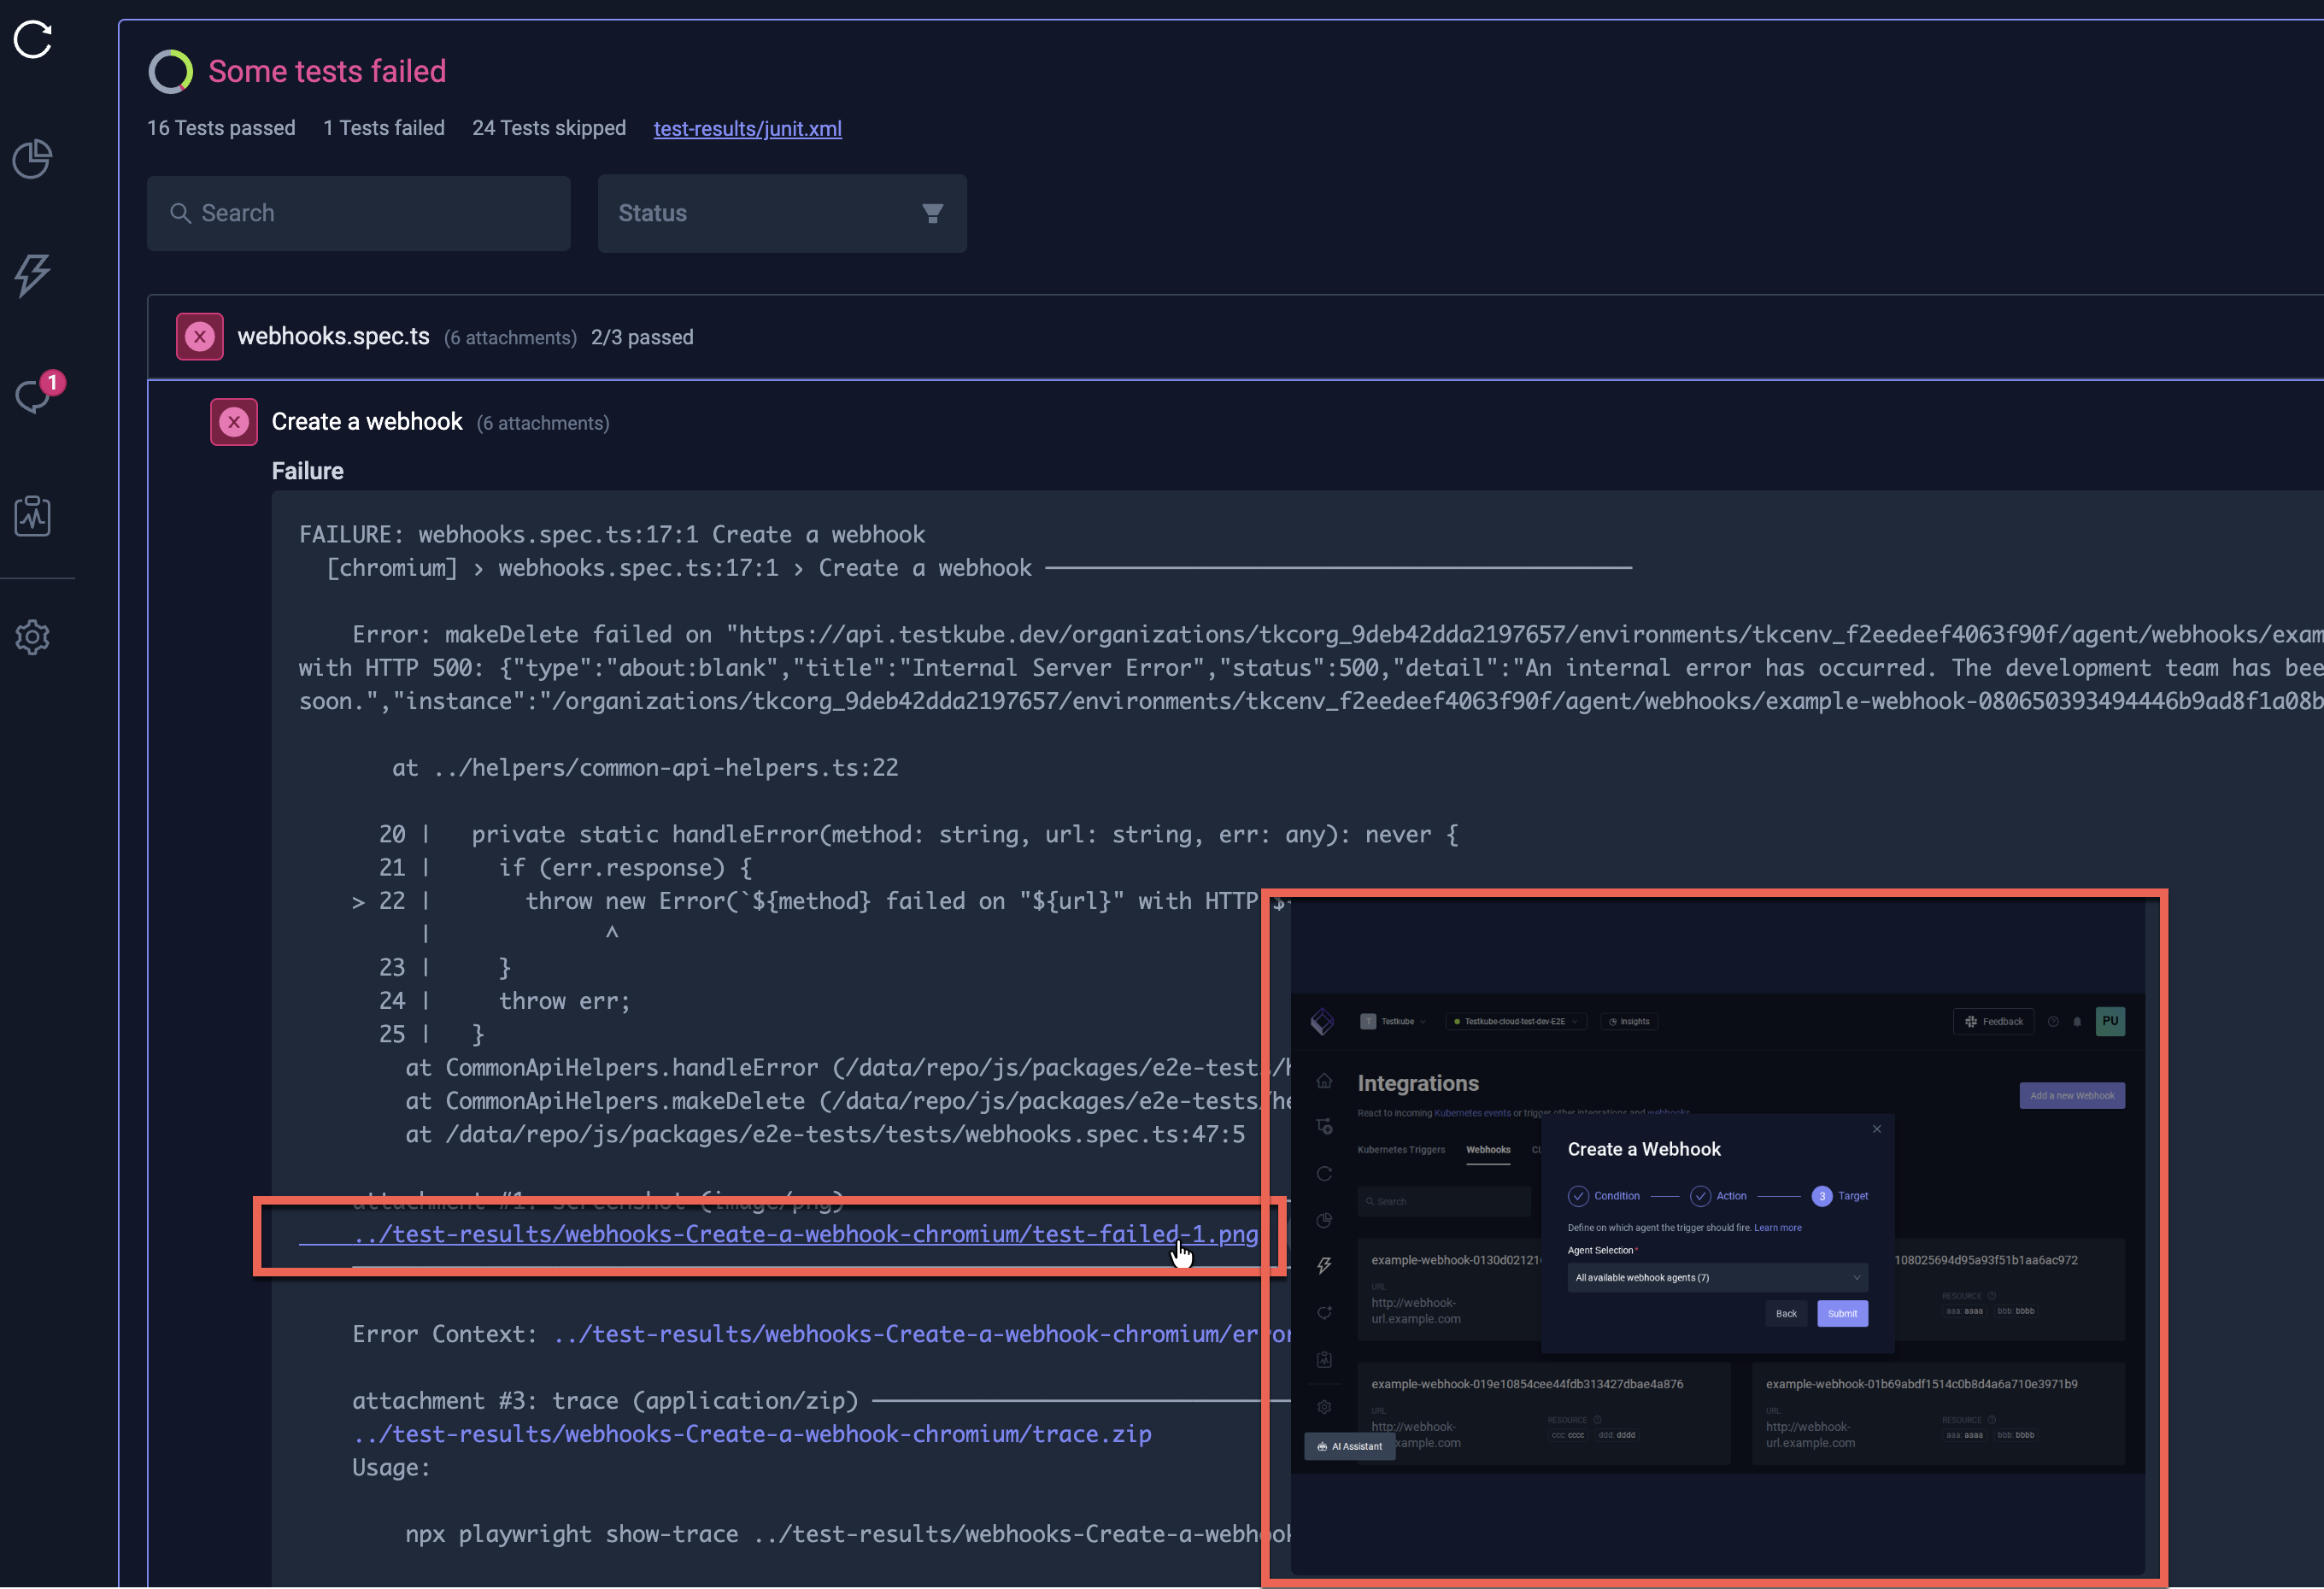
The JUnit Report will automatically expand the first failed test - to make it easy to navigate your failed tests for troubleshooting.
3. Test Insights
The Test Insights functionality allows you to analyse JUnit Case count over time, for example:
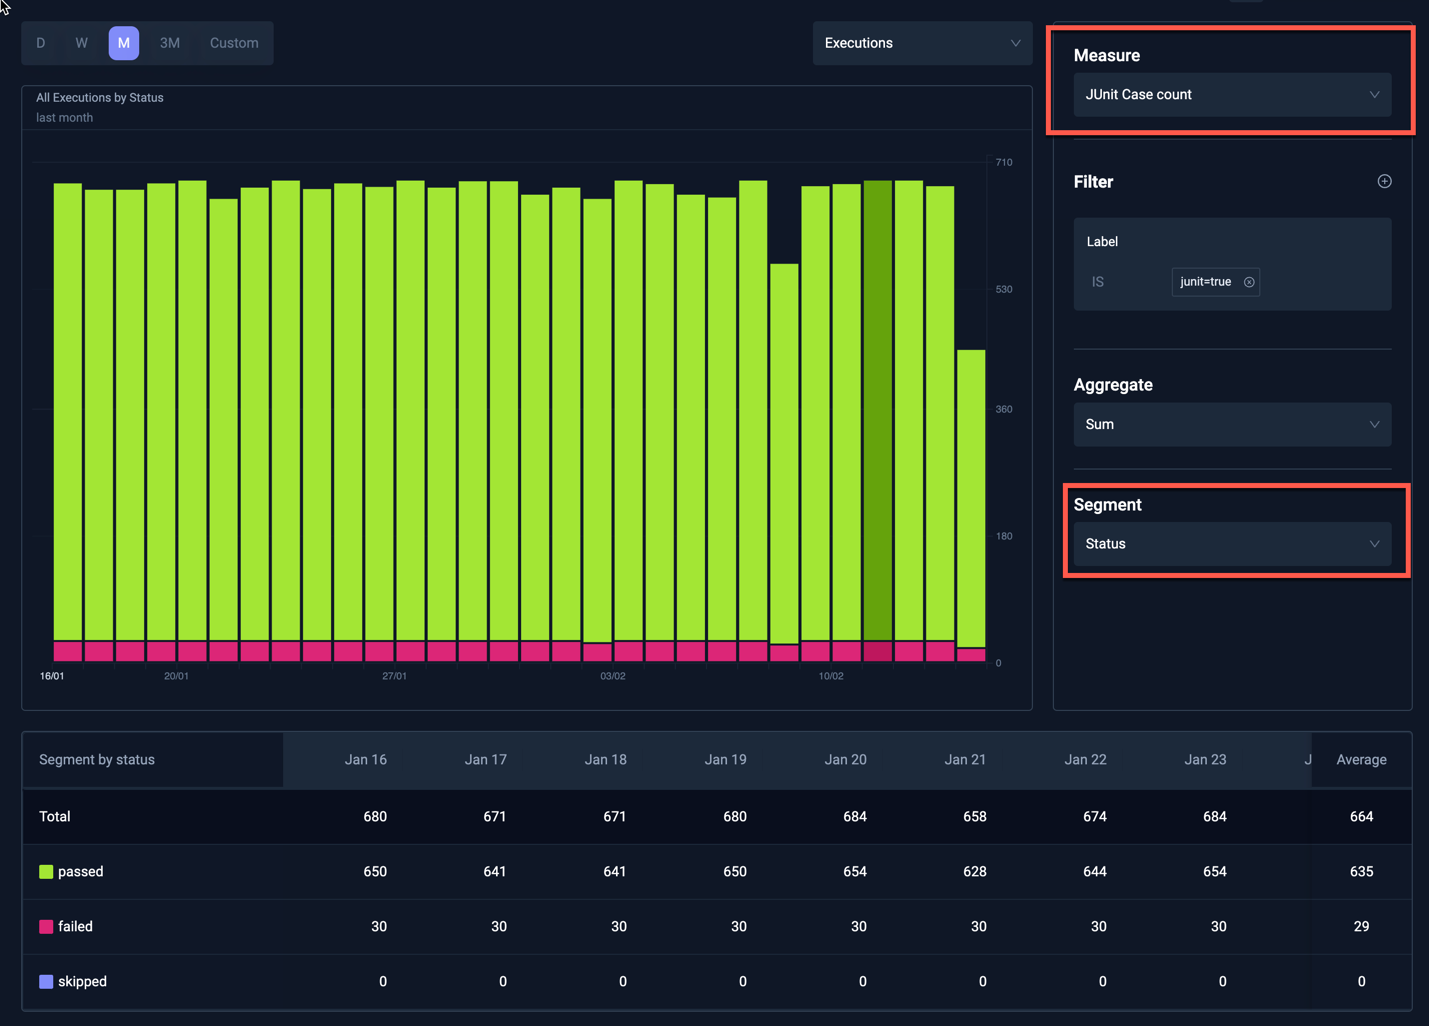
This shows the JUnit Case count per day over the last month, broken down by test status. The table at the bottom shows the individual numbers for each day, clicking on one of these numbers will list the corresponding Workflow executions, allowing you to further drill down into each segment - Read More.
Benefits of JUnit Report Visualization
The enhanced visualization of JUnit reports in Testkube offers several advantages:
- Quick Overview: Easily assess the overall health of your tests from the Execution Overview tab.
- Detailed Analysis: Dive deep into test results using the comprehensive Reports tab.
- Efficient Troubleshooting: Quickly identify and focus on failed tests or error messages.
- Improved Workflow: Seamlessly integrate JUnit report analysis into your testing and development process.
By leveraging these visualization features, teams can more effectively monitor test outcomes, identify issues, and maintain the quality of their software throughout the development lifecycle.
Creating JUnit Reports
See the examples below for how to create JUnit reports with some of the most common functional testing tools.
Always make sure that the generated reports are also included in the corresponding artifacts property for Testkube to find and process
them as described above.
Playwright
Add the --reporter=junit argument:
npx playwright test --reporter=junit
Read more in the Playwright Docs.
Postman
Add the junit reporter to the -r argument and specify the output file with --reporter-junit-export:
newman run my-collection.json -r cli,junit --reporter-junit-export /data/artifacts/junit-report.xml
Read more in the Newman Docs
Cypress
Add the --reporter and --reporter-options arguments:
cypress run --reporter junit --reporter-options "mochaFile=results/my-test-output-[hash].xml"
Read more in the Cypress Docs.
Pytest
Add the --junit-xml argument:
pytest tests --junit-xml=/data/artifacts/pytest-report.xml
Read more in the Pytest docs.
JUnit / TestNG with Maven
Make sure you have the surefire plugin added to your pom.xml file:
    <build>
        <plugins>
            <plugin>
                <groupId>org.apache.maven.plugins</groupId>
                <artifactId>maven-surefire-plugin</artifactId>
                <version>3.5.0</version>
            </plugin>

            ...
        </plugins>
    </build>
When you run the test goal the corresponding junit xml files will be generated into the target/surefire-reports folder:
mvn test
Read more in the Surefire Plugin docs
Go
Install the go-junit-report tool to convert Go test output to JUnit format:
go install github.com/jstemmer/go-junit-report/v2@latest
Run your tests and pipe the output through go-junit-report to generate the JUnit XML file:
go test -v 2>&1 ./... | go-junit-report -iocopy -set-exit-code -out /data/artifacts/junit-report.xml
The flags used above:
-iocopy: Copies stdin to stdout, useful for seeing test output in real-time-set-exit-code: Exits with non-zero code if tests fail-out: Specifies the output file location
Read more in the go-junit-report docs.
Jest
Add the jest-junit reporter package to your project:
npm install --save-dev jest-junit
Configure the reporter in your Jest config:
{
  "reporters": [ "default", "jest-junit" ]
}
Then run Jest normally to generate the report:
jest
For CI environments, you can explicitly specify the reporters:
jest --ci --reporters=default --reporters=jest-junit
Read more in the jest-junit docs.
Mocha
Install the Mocha JUnit reporter either locally:
npm install mocha-junit-reporter --save-dev
or globally:
npm install -g mocha-junit-reporter
Run Mocha with the JUnit reporter:
mocha test --reporter mocha-junit-reporter
By default, this creates test-results.xml in the current directory. You can specify a custom location for the report file in several ways:
Using an environment variable:
MOCHA_FILE=./path_to_your/file.xml mocha test --reporter mocha-junit-reporter
Using reporter options:
mocha test --reporter mocha-junit-reporter --reporter-options mochaFile=./path_to_your/file.xml
Or programmatically:
var mocha = new Mocha({
  reporter: "mocha-junit-reporter",
  reporterOptions: {
    mochaFile: "./path_to_your/file.xml",
  },
});
Read more in the mocha-junit-reporter docs.
Conclusion
Testkube's JUnit report processing and visualization features provide a powerful toolset for managing and analyzing test results. By automatically extracting data from JUnit XML reports and presenting it in both summary and detailed views, Testkube enables teams to gain valuable insights into their test workflows quickly and efficiently.
For more information on Testkube's reporting features, check out Test Insights.