Troubleshooting Tests
Introduction
Troubleshooting failed tests is a critical part of maintaining a robust testing pipeline—unless your tests never fail, in which case, hats off!
Before troubleshooting, you need to detect test failures, ideally via notifications from your CI/CD tools or collaboration platforms. Once a failure is identified, you’ll need access to:
- Logs/Reports/Artifacts: Generated by the testing tool.
- Component Logs/Traces: From the systems under test to help diagnose issues.
- Infrastructure Metrics: To address performance or network-related concerns.
Key Challenges in Traditional CI/CD Environments
Collecting the necessary data in a traditional CI/CD setup can be daunting because:
- Diverse Data Sources: Different testing tools produce various types of logs and artifacts.
- Custom Integration Needs: Efficient analysis often requires custom scripting or additional tools for searching and comparison.
- Manual Log Collection: Gathering logs from the systems under test is typically a manual process that relies on log aggregation or APM tools. Identifying the affected components and the correct time window can be challenging.
- Infrastructure Metrics: Similarly, pinpointing the relevant performance data may require extra effort.
Digging into Logs and Artifacts
After collecting the necessary artifacts, effective troubleshooting generally involves:
- Filtering Noise: Extracting the relevant information from the general “noise” in your logs.
- Error Identification: Searching for specific error codes or messages.
- Comparative Analysis: Comparing current logs or results with previous (successful) runs to identify changes.
Troubleshooting Tests with Testkube
Testkube simplifies the troubleshooting process with several built-in features:
-
Automated Collection:
Automatically gathers logs and artifacts from your test executions and makes them available in the Testkube Dashboard. -
JUnit Report Capture:
If your testing tool outputs standard JUnit reports, Testkube will capture those for further analysis. -
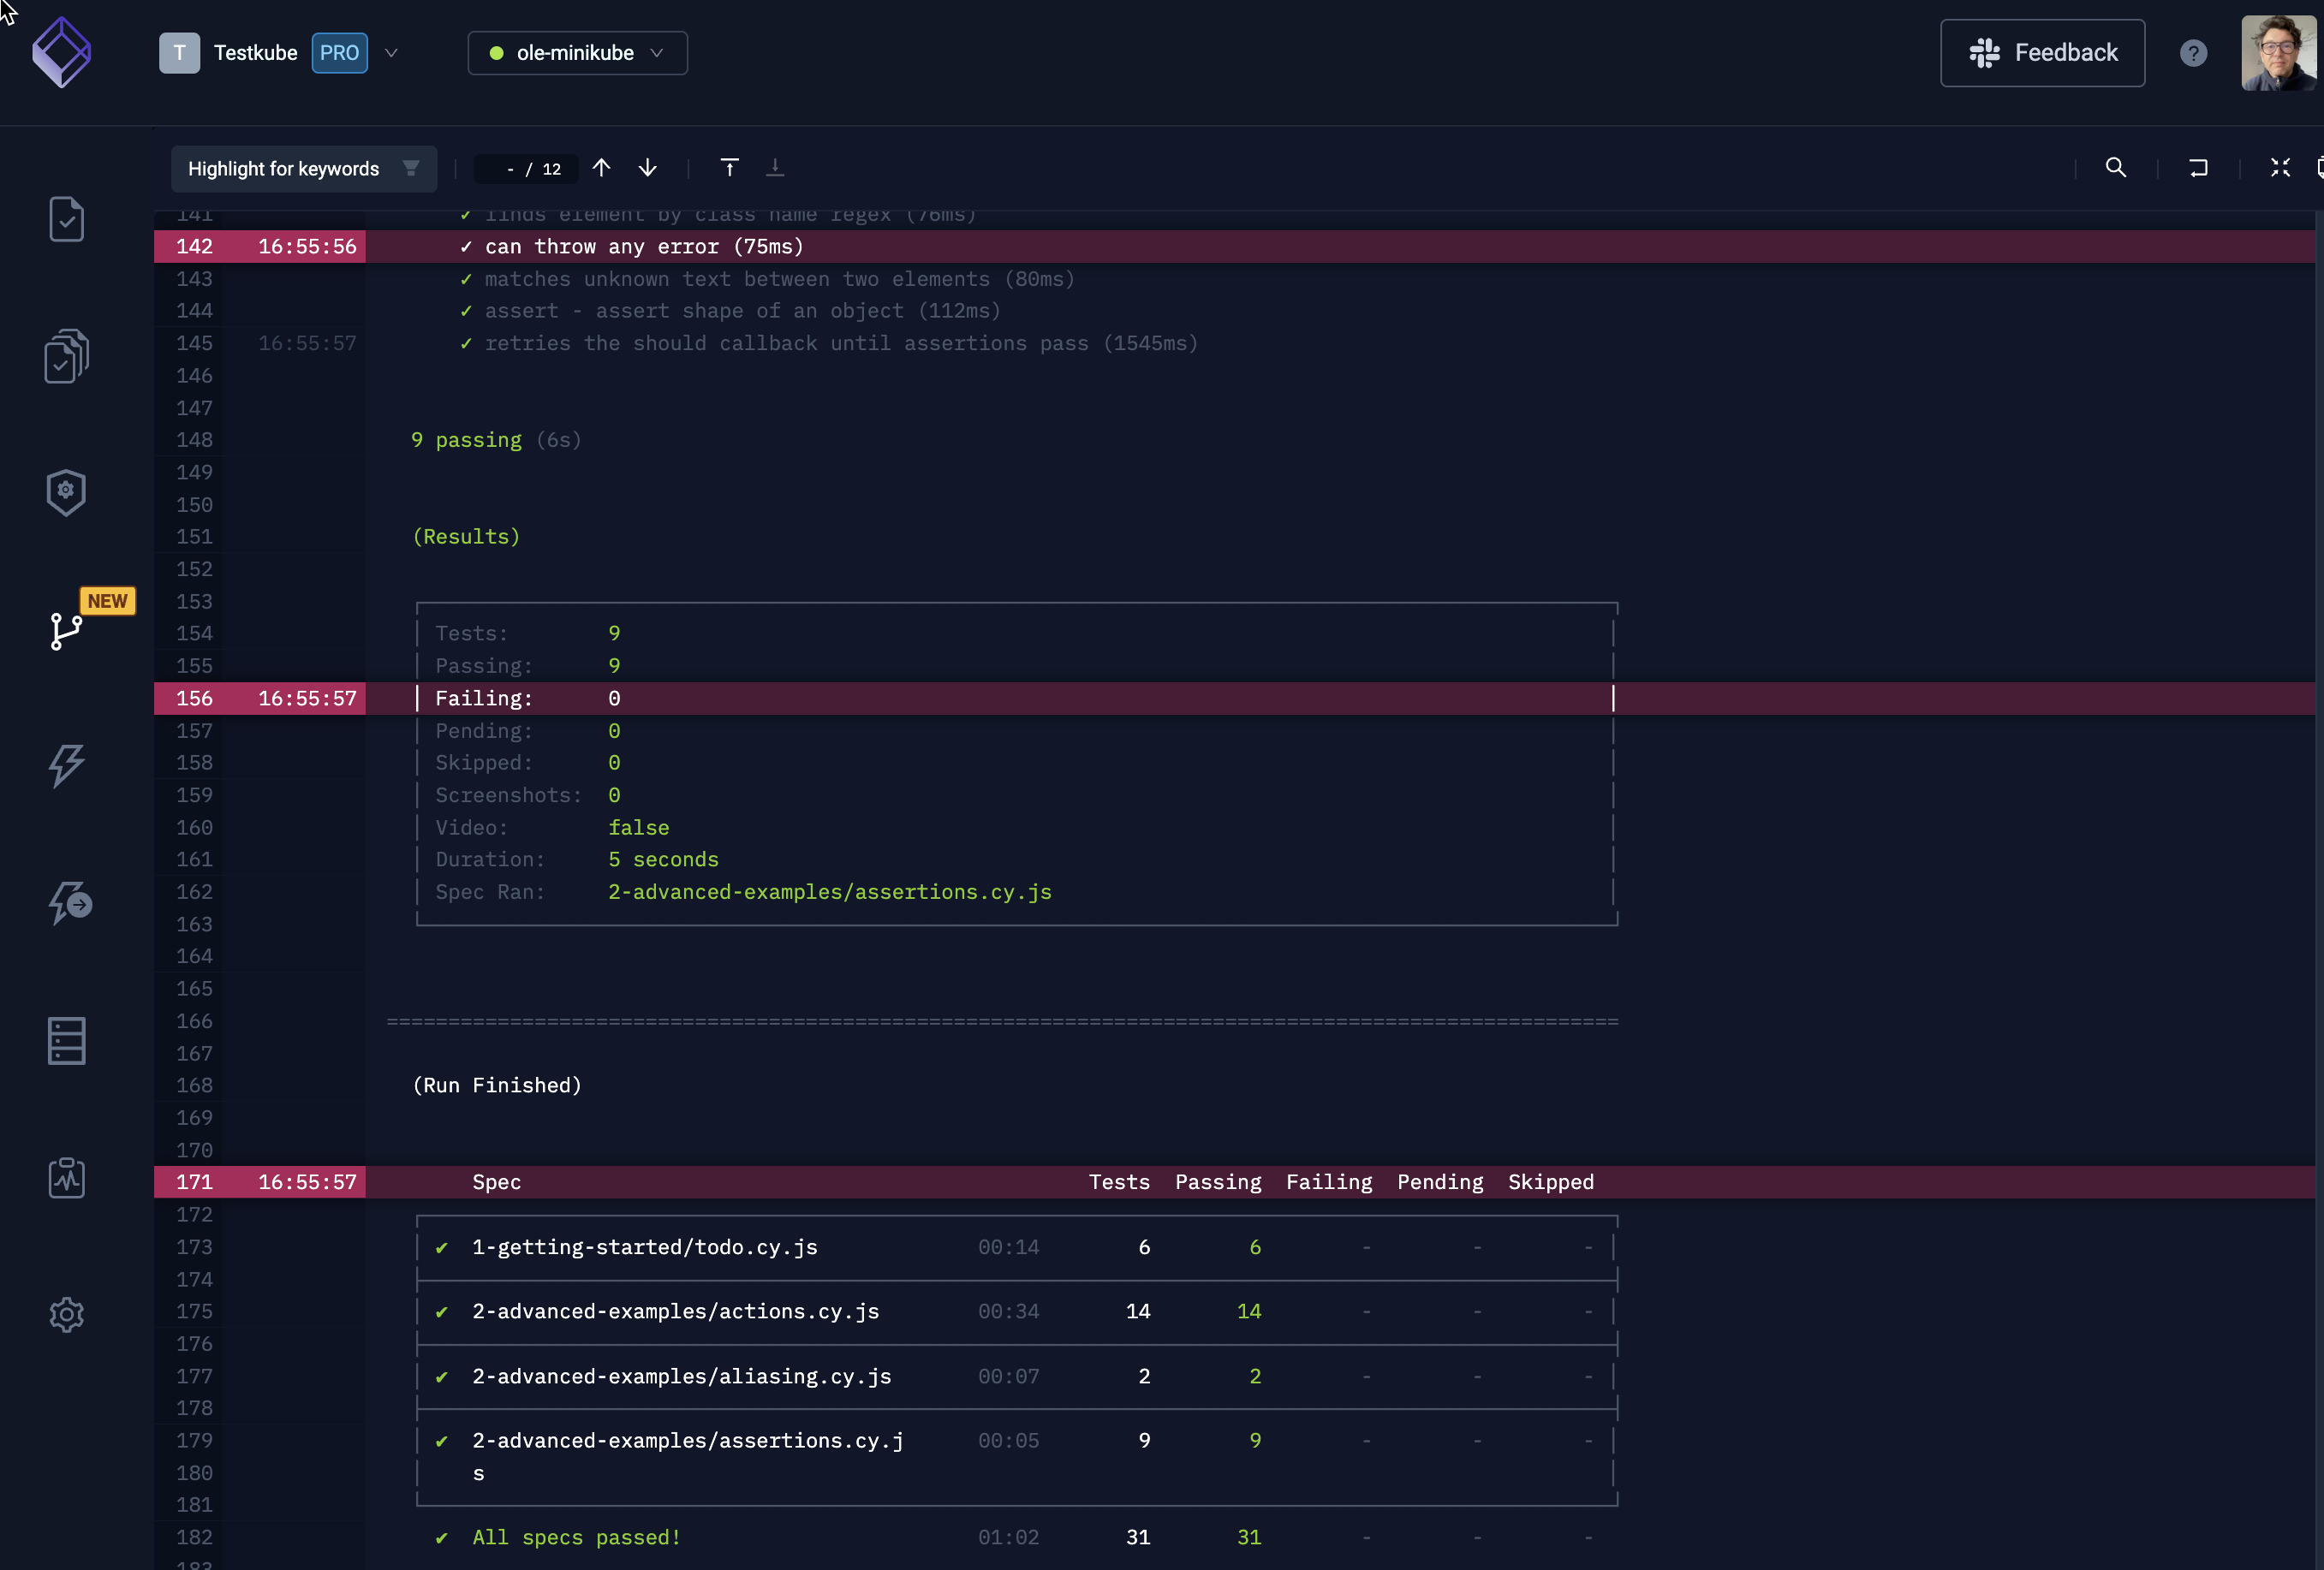
Enhanced Log Analysis:
The Dashboard offers features like Keyword Highlighting and Log Comparison to help you identify relevant content quickly. -
AI Insights:
The AI Insights module leverages GPT to analyze and interpret test logs, providing actionable insights.
Further Reading
For more details on analyzing your test results, read about Analyzing Test Results.